
Origin을 선택해야 하는 이유
Why Choose Origin?
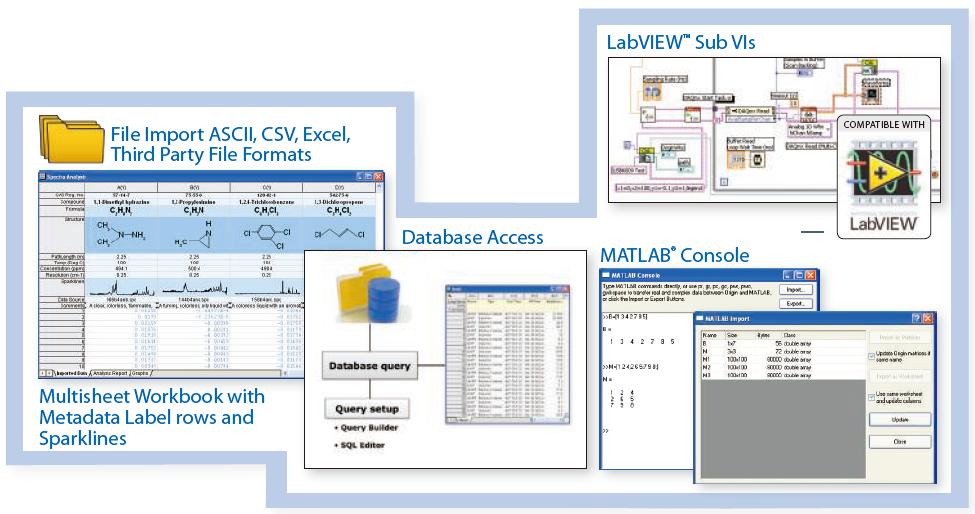
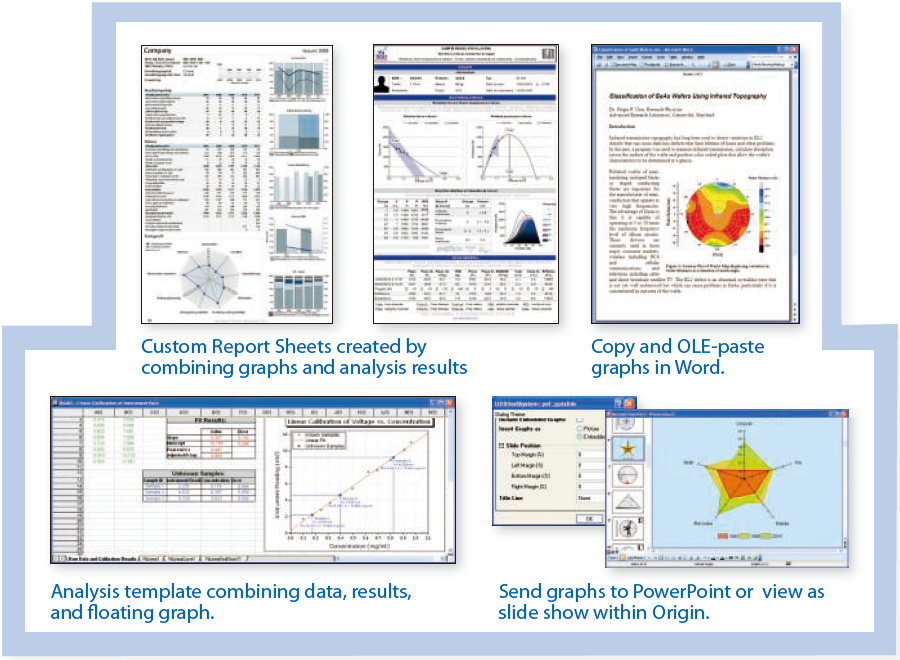
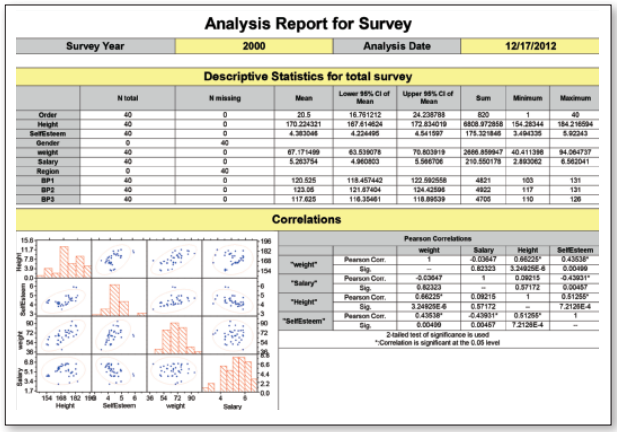
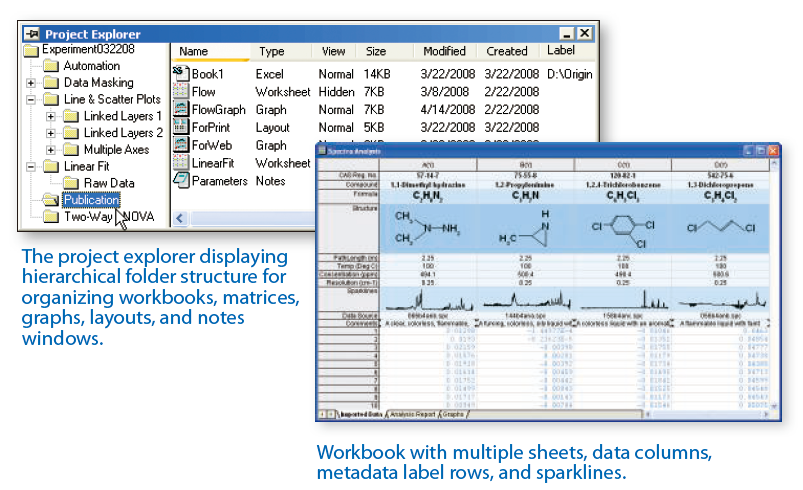
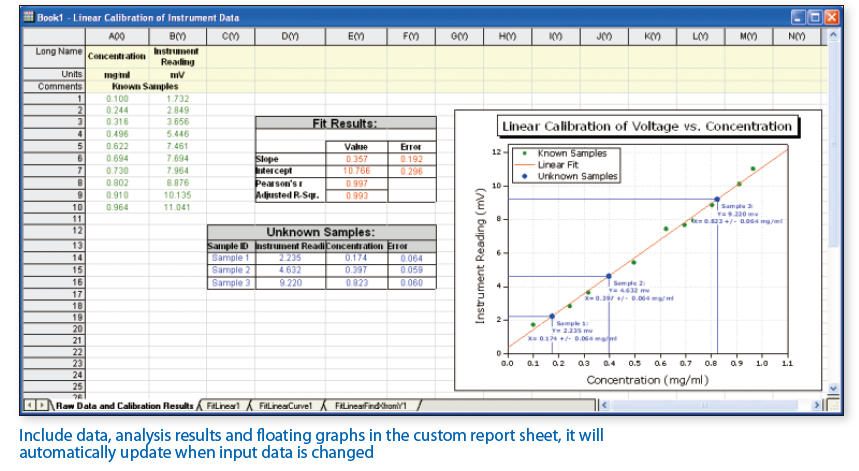
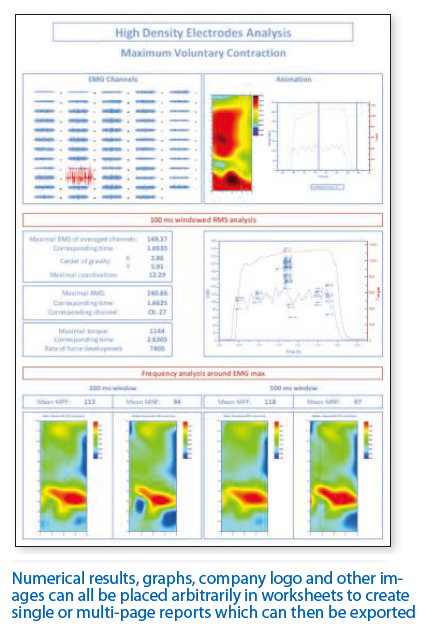
하나의 응용 프로그램으로 최종 보고서의
데이터를, 포인트 앤 클릭 엑세스합니다.
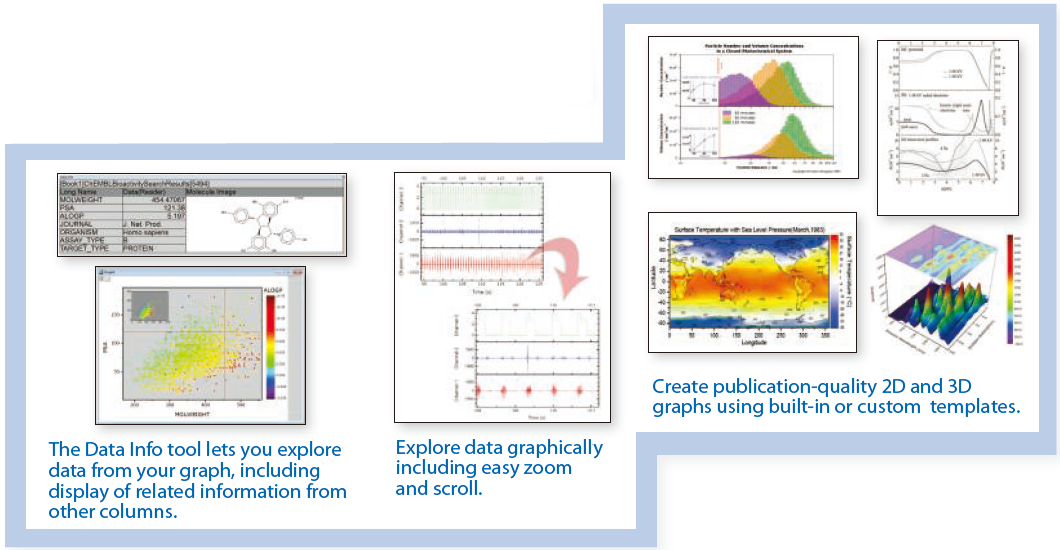
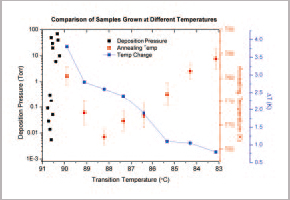
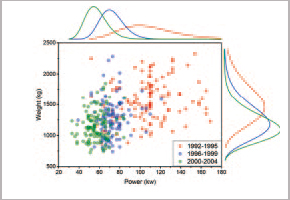
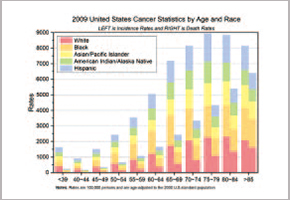
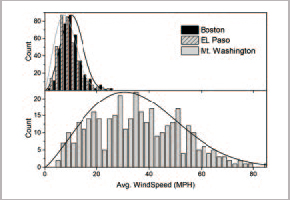
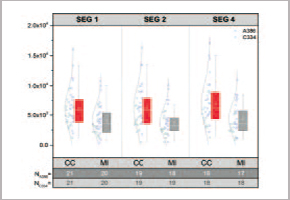
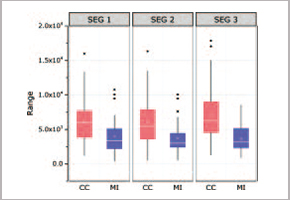
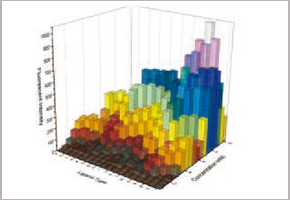
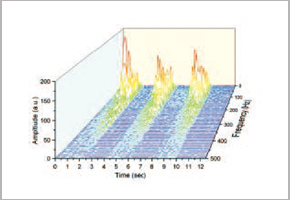
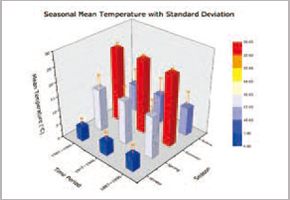
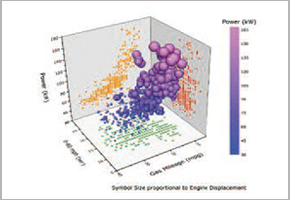
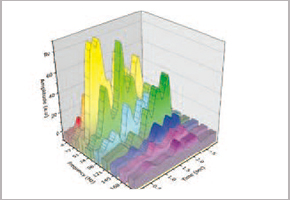
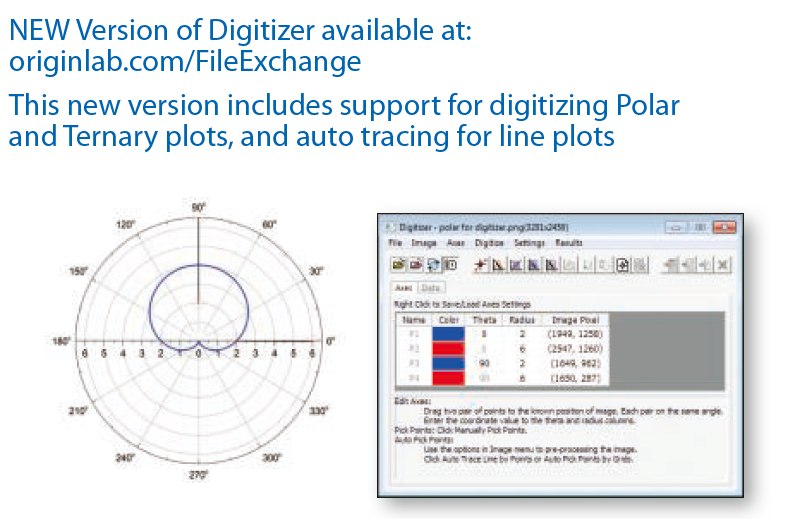
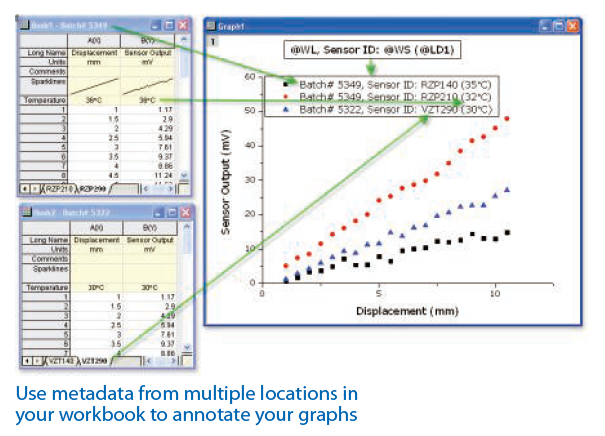
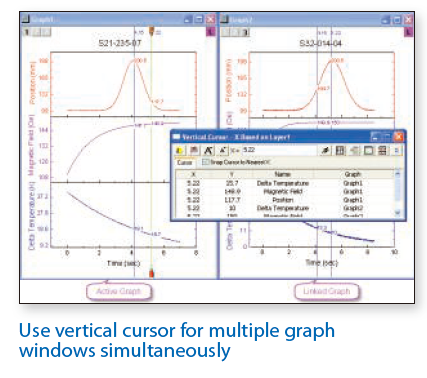
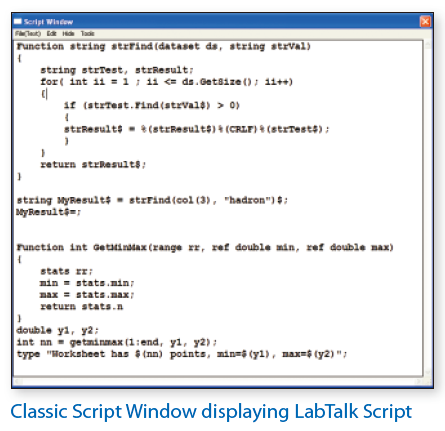
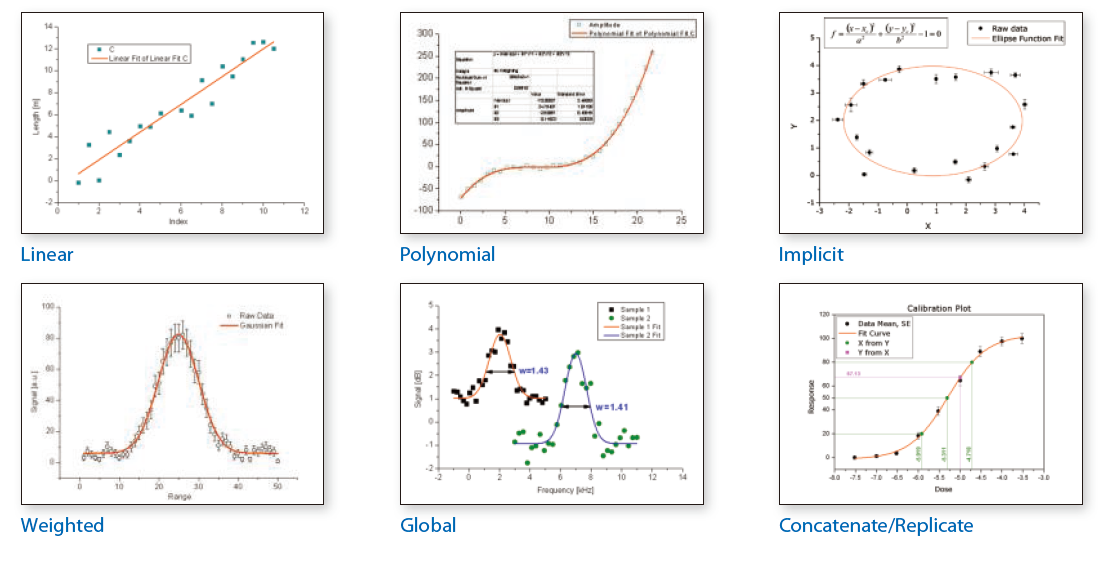
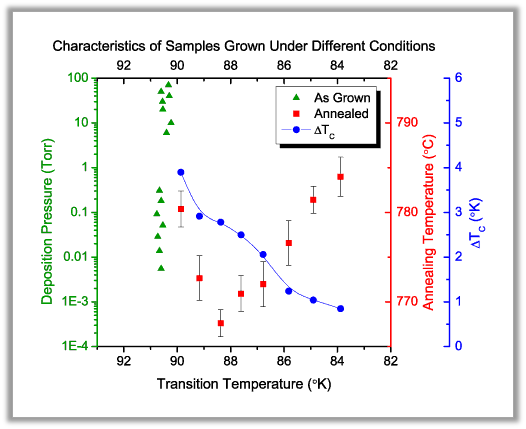
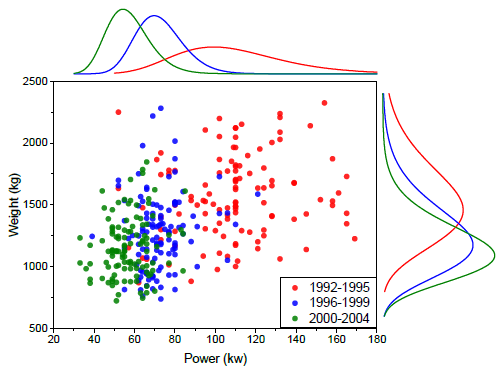
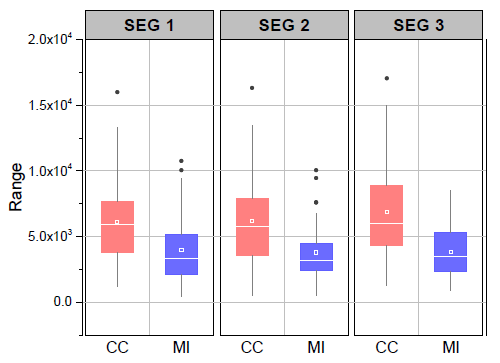
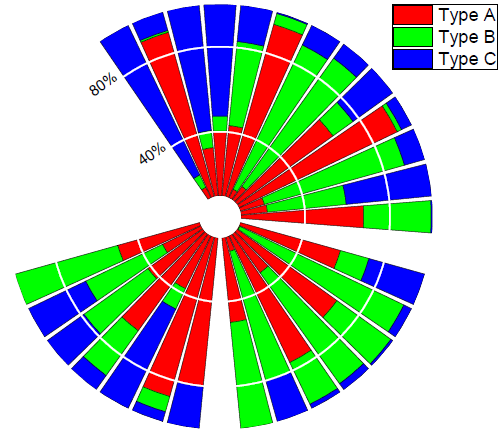
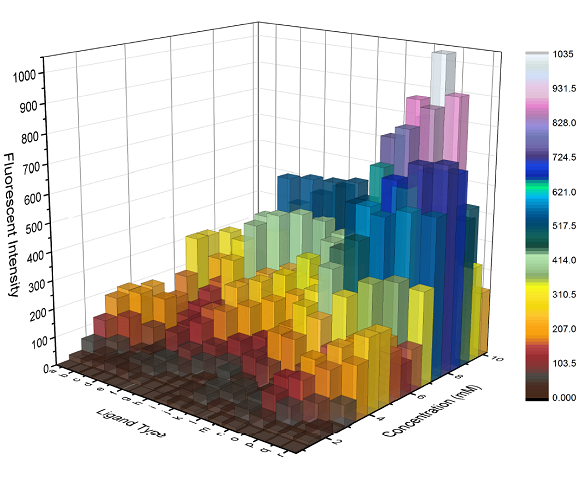
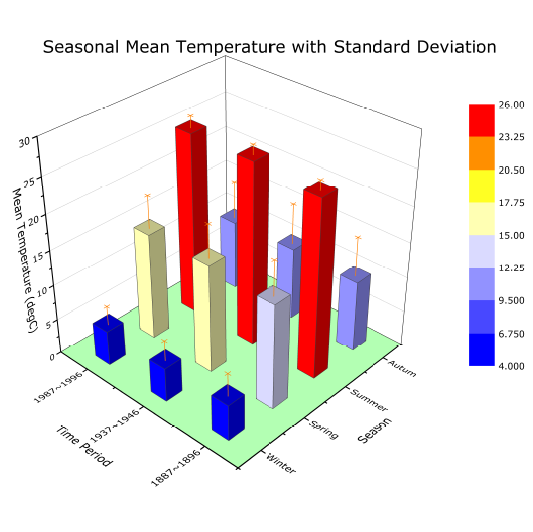
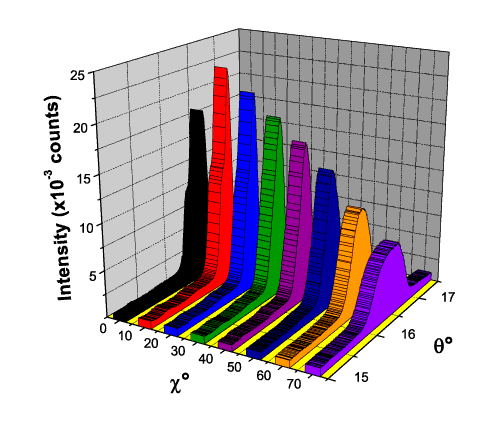
2D, 3D, Contour, Heat Map, Polar, 통계, Multi-axis와 Multi 패널그래프를 포함한 100개 이상의
내장 그래프를 지원합니다.
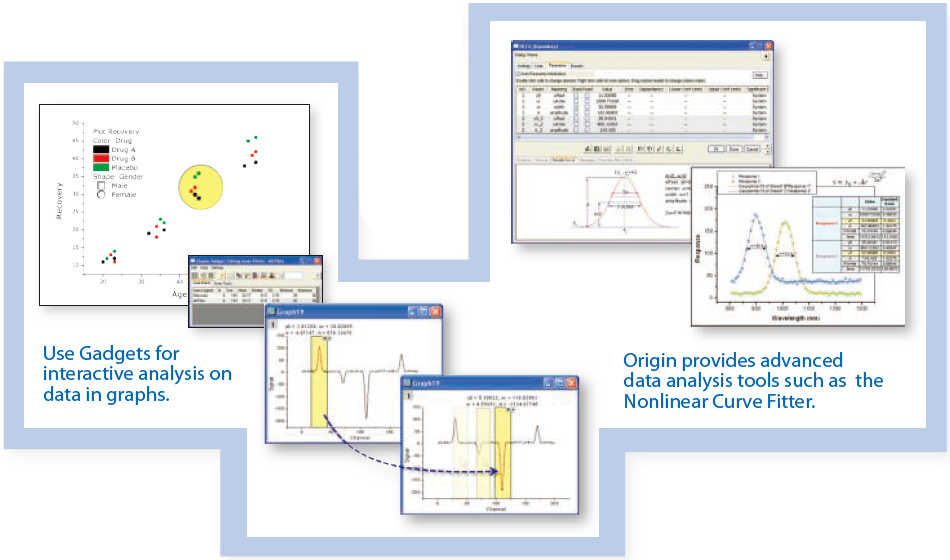
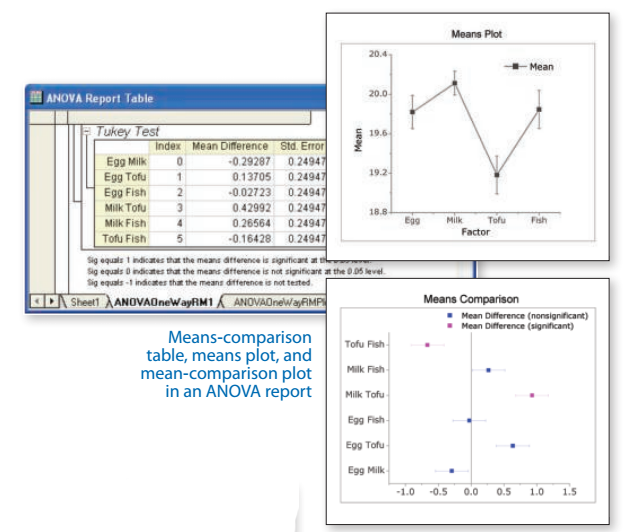
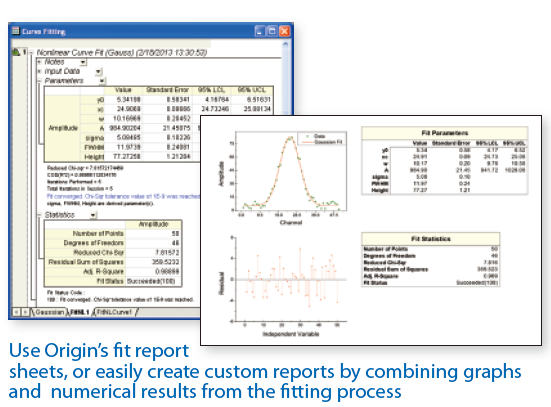
선형 및 비선형 곡선의 피팅 맞춤, 기준감지, 피크 통합 및 디컨볼루션 외 여러 기능을
평가하는 강력한 도구입니다.


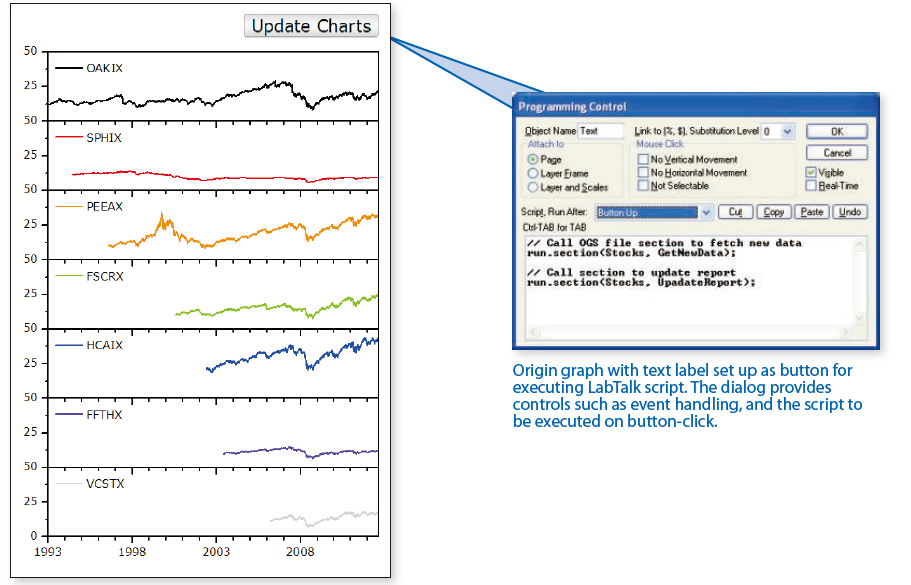
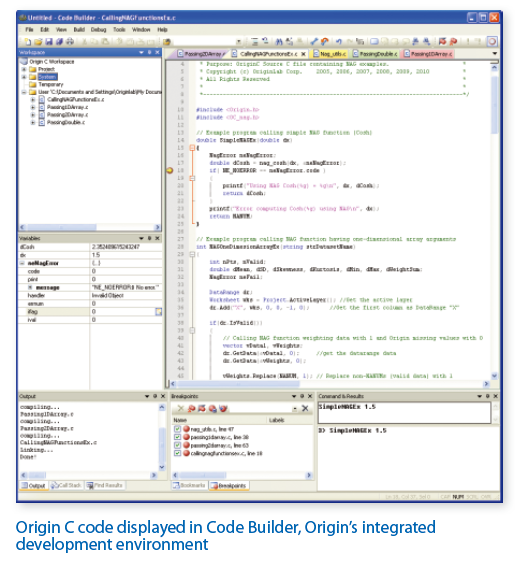
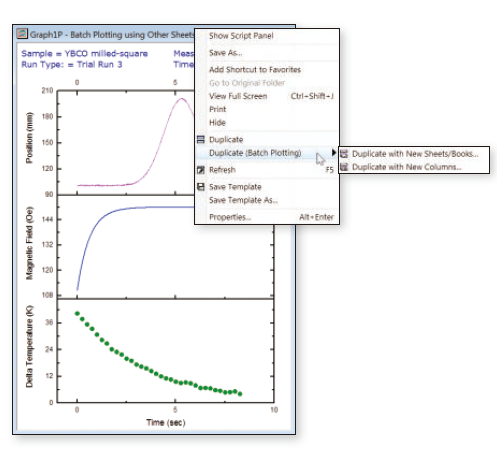
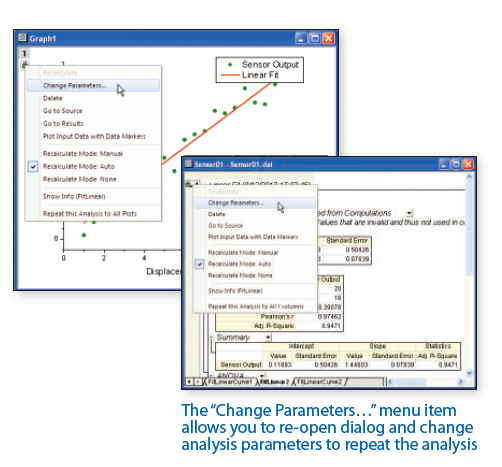
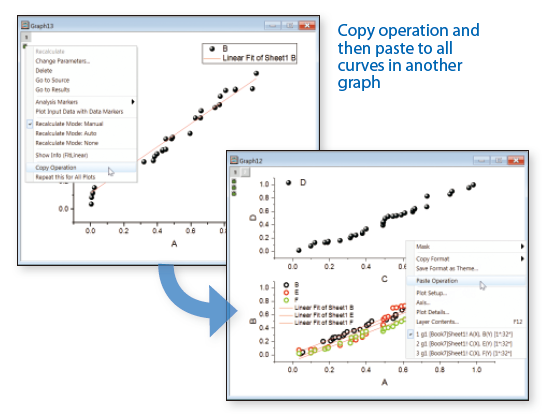
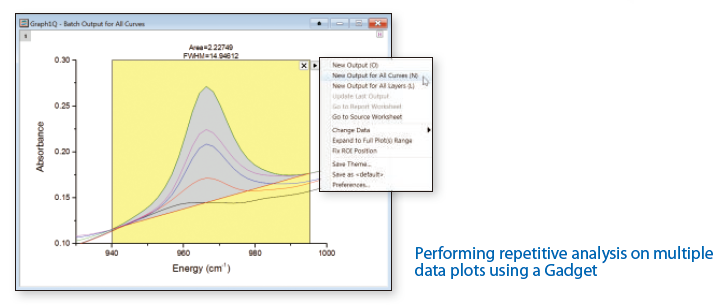
Batch Processing Without Programming
